“经典”空间语法分析中的概念和度量
凸空间:凸面空间定义为覆盖“该空间内的所有点(位置)可以连接到所有其他点(位置),而无需超出该空间的边界”的空间。换句话说,当两个人位于特定凸空间内的任何点时,他们可以看到对方。通视性对于识别凸空间至关重要。凸面空间主要被空间限制功能和人类活动(如站立和坐)所占据。
凸映射:对于空间分析,凸面地图用于分析建筑物内部的空间以及社区或小村庄中建筑物群之间的公共空间。分析范围从建筑空间到社区公共领域。在城市研究中,凸面地图被轴向地图取代;这仅仅是因为轴向贴图的生成和绘制速度比凸面贴图快得多。此外,凸分析的分析结果与轴向分析的结果一致。关于建筑物和小型城市社区,用于计算视觉图形分析的网格地图(VGA;见第2.2节)取代了凸面地图。
轴线:轴线是最长的视线,表示建筑环境中特定空间内的运动路径。在城市研究中,每条轴线代表一个与其他公共城市空间相连的公共城市空间。
轴向图:建筑环境的轴线图是一组最长和最少的轴线。轴向贴图可以具有不同的分辨率:低、中或高。低分辨率模型或战略模型仅包括构建环境各方面之间的主要关系。中等分辨率模型是一个扩展,其中添加了更多实用的内置和非内置特性关系。高分辨率模型或行人模型涉及对行人运动精确路径的研究。高分辨率模型与其他两个模型之间的主要区别在于,路面将是绘制轴向地图的焦点。此外,还存在混合模型,该模型结合了城市不同区域的不同分辨率。
isovist字段:isovist字段是从建筑环境中的特定点对观众全景视图的可视化。这是一个视野。isovist视野可以解释为从给定点以360度或180度视角观察的视觉记录。等视场图2显示了空间语法中使用的三个基本空间单元。图3显示了计算空间语法分析中使用的三种不同类型的基本映射。凸面图(图3c)是手工绘制的,这可能会很耗时,而且不受个人判断的影响。手动生成轴线图还需要培训和经验,以模拟社区或城市中可能的最小和最长轴线。因此,与凸面地图或轴面地图相比,应用于所有公共空间的基于光栅的地图(图3d)最省时。

图2。在空间语法中使用的基本空间单位。

图3。空间语法分析中使用的三种不同类型的映射。
城市电网:这是连接住区建筑的公共空间模式,无论其几何规则性如何。
深度:j图中节点的深度是从根节点到所选节点的路径中的边数。例如,根的深度为0,其任何一个相邻节点的深度为1。从根节点到最终节点的节点数较多的路径在拓扑上较深,反之亦然,节点数较少的路径在拓扑上较浅。
总深度(TD):这是由从系统中选定或给定起点穿过的空间数量定义的。系统的总深度是从给定起点开始的所有可能步骤的总和。深度值与系统本身的实际形状相结合,为城市空间的解释和分析提供了重要信息。术语“浅”和“深”最常用于系统的深度。浅层系统的总深度值较低,而深层系统的总深度值较高。浅层系统的j图是灌木状的,而深层系统的j图是树状的。图4描述了如何将公共空间抽象为轴线,并构成定居点4(a)的轴线图4(b)。空间分析展示了定居点轴向地图的全球整合分析的可视化。下图4d显示了一个j图(对齐图),使用主街作为根节点a。
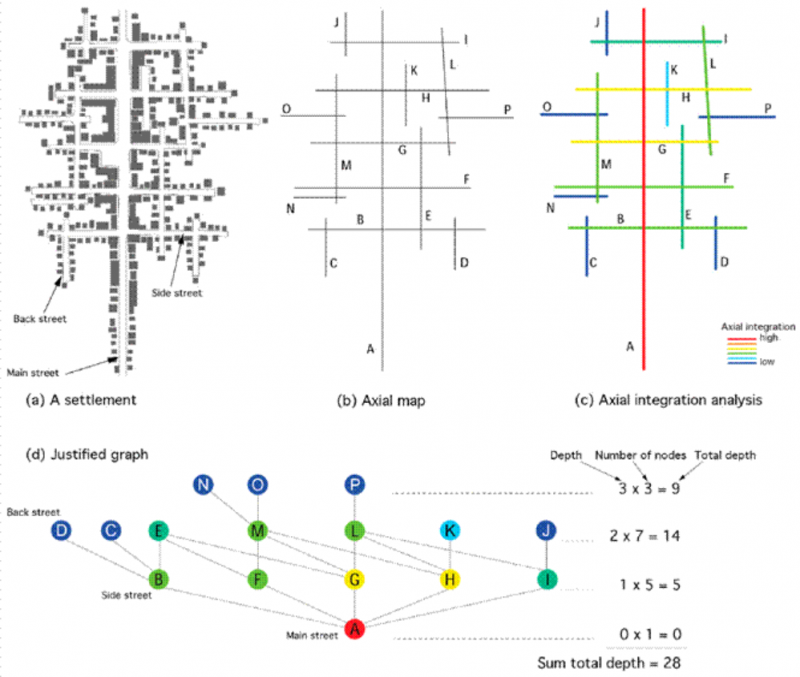
图4 定居点(a)和对正图(d)的轴向图(b)和全局轴向积分分析(c),根节点a代表主要街道。
连通性:连通性是一种静态的局部测量,解释了每条街道与其直接相邻街道之间的连接数量。在数学中,连通性是图论的基本概念之一。与侧街连接较多的街道具有较高的连接值,而连接较少的街道具有较低的连接值。
轴向积分(Int):考虑到城市实体的方向变化(句法步骤)总数,该措施考虑了移动,并估计了一条街道对城市系统中所有其他街道的可达性程度。轴向整合与连通性密切相关。某条街道与系统中所有其他街道之间的方向变化越少,其集成度越高,因此其可通达性越高。简言之,城市地区的轴线越长,其与其他线路的连通性越高,其整合值越高,反之亦然。
全局和局部半径:经典空间语法分析通常使用拓扑半径,这是指方向变化的数量。对于“全局”集成分析(如空间语法术语中所述),半径为n,而在局部集成分析中,半径通常为3或5[7]。全局轴线整合分析,也称为全市整合分析,根据所有其他轴线的方向变化总数计算建筑环境中每条轴线与所有其他轴线的连接方式。相比之下,局部轴积分分析根据给定数量的方向变化计算建筑环境中每条轴线如何连接到其相邻街道。需要注意的是,局部半径最初是通过考虑根节点来计算的。这意味着,例如,半径3是通过根节点的两个方向变化(=两个语法步骤+根节点)计算的。这在2005年之后发生了变化,当时不再包括根节点。因此,3的半径当前等于三个方向变化(=三个语法步骤)。局部集成分析有助于减少全局集成分析中出现的边缘效应。
图5说明了如何使用图4中的沉降示例计算拓扑浅层和深层系统的轴向积分。我们演示如何计算轴向积分。以主街为根节点的灌木状j图与以后街为根节点的拉长j图相比,在拓扑上更浅。主街道可以到达总转向次数较少的所有街道,而后街道可以到达总转向次数较多的所有街道。为了说明基本空间语法概念的应用,我们使用了鹿特丹的案例研究。鹿特丹是南荷兰省的一个主要港口城市,也是荷兰第二大城市。该国人口约65万,以多民族混合而闻名。第二次世界大战中,历史悠久的城市中心几乎完全被摧毁,鹿特丹现在的城市景观中出现了现代建筑和摩天大楼。图6显示了鹿特丹三种不同类型的轴向分析。全球整合分析(图6c)显示了空间整合程度最高的街道的位置。对于鹿特丹来说,最完整的街道和道路位于环路的东段。红色和橙色轴线显示了最高度综合街道的5%分数。半径为3的局部整合(图6d)描绘了局部整合程度最高的街道。在本分析中,各种本地购物街用黄色和橙色线条表示。连接图(图6b)显示了每个轴与其直接相邻轴之间的直接连接数量。深蓝色线有一到两个连接,而黄色和红色线有多达32个连接。
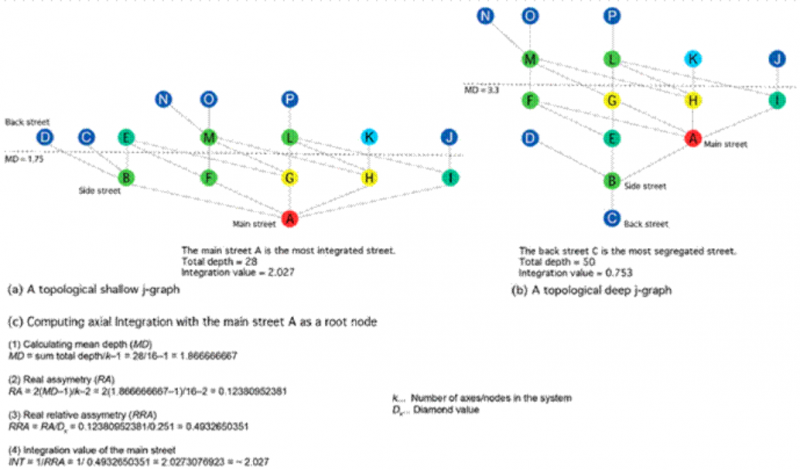
图5。(a) 主街道的拓扑浅j图和(b)后街道的拓扑深j图;(c) 解释如何计算浅j图的“全局”轴积分。
句法步骤:这是指城市系统中的单向变化。例如,两个语法步骤意味着两个方向的变化。三个句法步骤意味着三个方向的变化。
两部分析:这种类型的分析说明了从特定街道或道路或从选定的一组街道和道路在两个方向变化内可以到达多少条街道。这种分析方法主要用于了解购物街的局部集水区。
N步分析或点深度分析:这种类型的分析表明,就方向变化的数量而言,所有街道和道路相对于一条或多条特定街道的拓扑深度。选定街道或一组选定街道的方向变化数量越大,区域的拓扑结构越深。
图7显示了对鹿特丹市中心主要购物街之一Lijnbaan的两步分析。红色轴线(图7b)表示分析的起点。两步分析显示了从Lijnbaan起点开始的两个方向变化内可到达的街道数量,并描绘了Lijnbaan的局部集水区。购物街通常有大量位于两个方向变化范围内的街道。尽管Lijnbaan的位置在空间上是“隐藏的”(图7a),但其在当地集水区内的连通性很高。
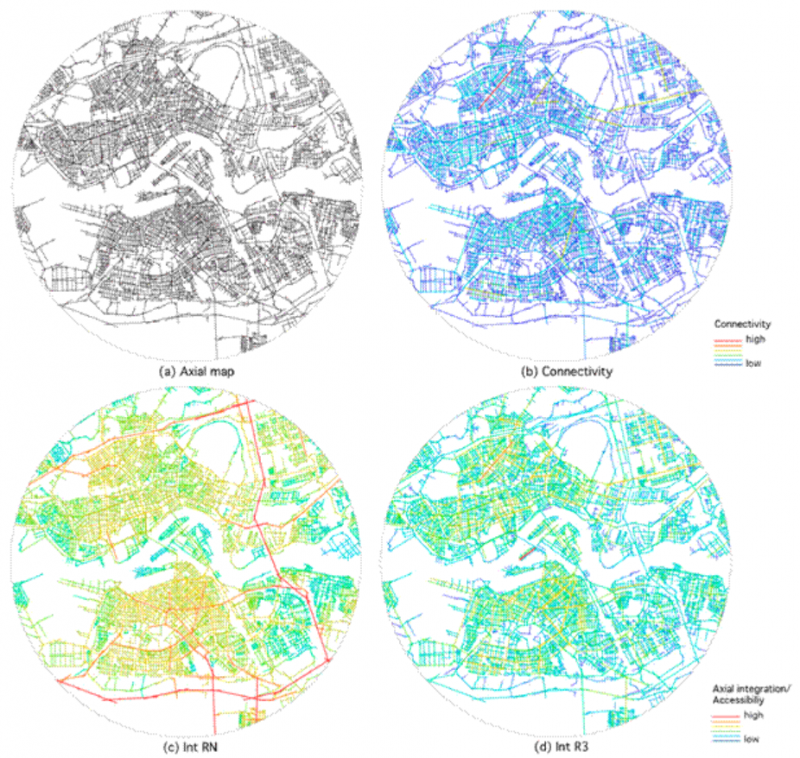
图6(a) 鹿特丹轴向地图和(b)连通性,(c)全球和(d)局部轴向整合分析。
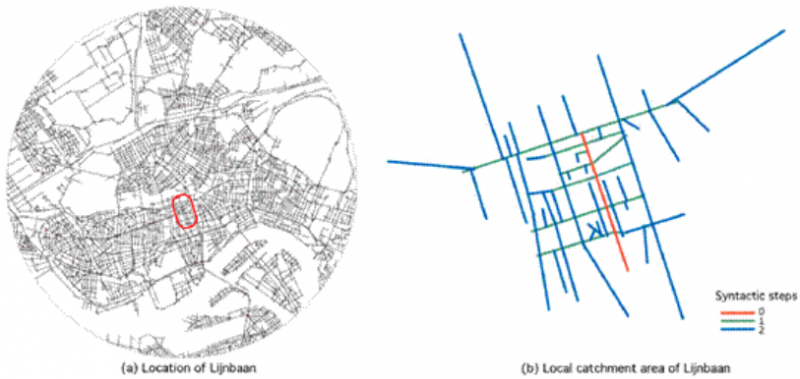
图7。(a) 鹿特丹Lijnbaan购物街的位置和(b)idem的两步分析。
清晰度:这是衡量城市整体整合和连通性价值之间的相关性[48,49],或者更一般地说,全球和地方整合价值之间的相关性[14],表明城市系统的可理解程度。相关系数(R2)越接近1.0,系统的可懂度水平就越高。这意味着,基于局部区域的街道模式逻辑,可以理解整个城市。可理解性的概念也指认知映射,它与凯文·林奇的易读性概念有关。
图8显示了鹿特丹本地整合(Int r=3)与全球整合(Int r=n)的散点图。黑色像素代表鹿特丹市中心的街道(=轴线)。尽管鹿特丹市中心在2008年遭到严重轰炸第二次世界大战期间,在重建市中心的过程中保留了原有的街道格局。整个城市的相关系数(R2)为0.1359,较低。市中心的相关系数(R2)平均为0.4398。
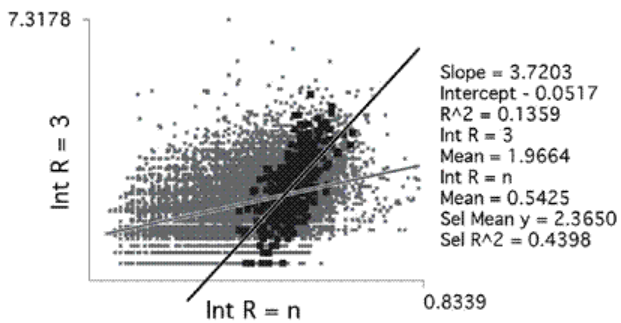
图8。鹿特丹可理解性散点图,显示鹿特丹本地和全球轴向一体化之间的相关性。
半径(RadR):设置半径度量是为了将整个空间系统的边缘效应降至最低。半径-半径计算在过去很流行,它使用的是平均深度,因为这代表了利用模式的真实特征。半径-半径分析是一种轴向积分分析,它使用系统中最全局积分的轴线的平均深度值的平均值,并将其用作最大半径。这样做是为了减少边缘效应。
积分梯度:这是第一次尝试制定一个方程式,用于确定一个城市的主要路线。计算中考虑了局部积分。具有真实相对不对称性(RRA)的r=3的积分梯度计算如下:(RRA3)/average{average{RRA3}}[51]。角度选择分析取代了积分梯度计算。
构成和不构成的街道和城市空间:•当街道或城市空间的入口与相邻建筑物直接相连时,构成街道或城市空间。违宪街道或城市空间没有与之相连的入口。
边缘效应:全球轴向一体化存在边缘效应。局部测量(如半径为3)可将边缘效应降至最低,但不能消除边缘效应。因此,重要的是在节点(或区域)周围有足够的空间缓冲区,以产生正确和“干净”的结果。未考虑空间缓冲区和轴向积分的轴向地图在周围没有精确缓冲区的区域会产生人为的低结果[3](第120页)。空间缓冲区处理上下文区域的大小。不同的研究方法导致对这个问题的不同回答。作为实践中使用的经验法则,30分钟的测试是最常用的。如果检查行人运动,该测试相当于30分钟步行(约2000米)。同样,Agora技术平台报告[52]提到,车辆轴向地图将选择一个距离感兴趣区域30分钟车程的区域。因此,车辆地图相当大,通常描绘调查中的整个城市。
Concepts and Measuresfrom ‘Classic’ Space Syntax Analysis
![]() Convex space: A convex space is defined as a space that covers “all points (locations) within that space can be joined to all others without going outside the boundary of that space.” (p. 68). In other words, two people can see each other when they are located in any spot within a particular convex space. Intervisibility is essential for identifying a convex space. Convex space is mostly occupied by place-bound functions and human activities such as standing and sitting.
Convex space: A convex space is defined as a space that covers “all points (locations) within that space can be joined to all others without going outside the boundary of that space.” (p. 68). In other words, two people can see each other when they are located in any spot within a particular convex space. Intervisibility is essential for identifying a convex space. Convex space is mostly occupied by place-bound functions and human activities such as standing and sitting.
![]() Convex map: For spatial analysis, convex maps are used to analyze spaces inside buildings and the public spaces between groups of buildings in a neighborhood or a small village. The analytical scale ranges from architectural space to a neighborhood’s public realm. The convex map is replaced by the axial map in urban studies; simply because an axial map can be generated and drawn much faster than a convex map. Moreover, the analytical results of a convex analysis comply with those from an axial analysis (p. 68). Regarding buildings and small urban neighborhoods, a grid-based map to compute visual graph analysis (VGA; see Section 2.2) replaced the convex map.
Convex map: For spatial analysis, convex maps are used to analyze spaces inside buildings and the public spaces between groups of buildings in a neighborhood or a small village. The analytical scale ranges from architectural space to a neighborhood’s public realm. The convex map is replaced by the axial map in urban studies; simply because an axial map can be generated and drawn much faster than a convex map. Moreover, the analytical results of a convex analysis comply with those from an axial analysis (p. 68). Regarding buildings and small urban neighborhoods, a grid-based map to compute visual graph analysis (VGA; see Section 2.2) replaced the convex map.
![]() Axial line: An axial line is the longest sightline that indicates a movement path in a certain space within the built environment. In urban studies, each axial line represents a public urban space that connects to other public urban spaces (p. 97).
Axial line: An axial line is the longest sightline that indicates a movement path in a certain space within the built environment. In urban studies, each axial line represents a public urban space that connects to other public urban spaces (p. 97).
![]() Axial map: An axial map of a built environment is the set of the longest and the fewest axial lines (pp. 17, 91, 97), . An axial map can be of different resolutions: low, medium or high. A low-resolution model, or strategic model, includes only the major relationships between aspects of the built environment. A medium-resolution model is an extension to which more pragmatic relations of built-up and non-built- up features are added. A high-resolution model, or pedestrian model, involves the study of the precise paths of pedestrian movement. The major difference between the high-resolution model and the other two models is that the pavement will be the focal point for drawing an axial map. Furthermore, hybrid models exist, which combine different resolutions for different areas in a city.
Axial map: An axial map of a built environment is the set of the longest and the fewest axial lines (pp. 17, 91, 97), . An axial map can be of different resolutions: low, medium or high. A low-resolution model, or strategic model, includes only the major relationships between aspects of the built environment. A medium-resolution model is an extension to which more pragmatic relations of built-up and non-built- up features are added. A high-resolution model, or pedestrian model, involves the study of the precise paths of pedestrian movement. The major difference between the high-resolution model and the other two models is that the pavement will be the focal point for drawing an axial map. Furthermore, hybrid models exist, which combine different resolutions for different areas in a city.
![]() Isovist field: An isovist field is a visualization of the panoptic view of a viewer from a particular point in the built environment . It is a field of vision . An isovist field can be explained as a visual record of what can be seen in a 360-degree or a 180-degree view from a given point .
Isovist field: An isovist field is a visualization of the panoptic view of a viewer from a particular point in the built environment . It is a field of vision . An isovist field can be explained as a visual record of what can be seen in a 360-degree or a 180-degree view from a given point .
Figure 2shows the three basic elementary spatial units that are used in space syntax. Figure 3shows three different types of basic maps that are used in computational space syntax analyses. Convex maps (Figure 3c) are drawn by hand and this can be time- consuming and is not free from individual judgement. Generating an axial map manually also requires training and experience to model the least and the longest axial lines possible in a neighborhood or a city (Figure 3b). Therefore, the raster-based map (Figure 3d) that is applied to all public spaces turns out to be the least time-consuming to apply compared to a convex map or an axial map .

Figure 2. The elementary spatial units that are used in space syntax.

Figure 3. Three different types of maps that are used in space syntax analysis.
![]() Urban grid: This is the pattern of public spaces that links the buildings of a settlement, regardless of its degree of geometric regularity (p. 02.1).
Urban grid: This is the pattern of public spaces that links the buildings of a settlement, regardless of its degree of geometric regularity (p. 02.1).
![]() Justified graph (j-graph): A justified graph illustrates the spatial relationships or con- nections between various spaces as a directional graph. Each space is represented by a node (=vertex or point; in space syntax this is the street itself), while a connection between two nodes is represented by an edge (=line) . In order to generate a justi- fied graph, only the spatial configurational relationship is taken into consideration. A j-graph does not display geometric properties. An axial map is the geometric model of an urban street network that can translate into a j-graph.
Justified graph (j-graph): A justified graph illustrates the spatial relationships or con- nections between various spaces as a directional graph. Each space is represented by a node (=vertex or point; in space syntax this is the street itself), while a connection between two nodes is represented by an edge (=line) . In order to generate a justi- fied graph, only the spatial configurational relationship is taken into consideration. A j-graph does not display geometric properties. An axial map is the geometric model of an urban street network that can translate into a j-graph.
![]() Depth: The depth of a node in a j-graph is the number of edges in the path from the root node to the chosen node. For instance, the depth of the root is 0 and the depth of any one of its adjacent nodes is 1 . A path that has a high number of nodes from the root node to the final node is topologically deep and, vice versa, a path that has a low number of nodes is topologically shallow.
Depth: The depth of a node in a j-graph is the number of edges in the path from the root node to the chosen node. For instance, the depth of the root is 0 and the depth of any one of its adjacent nodes is 1 . A path that has a high number of nodes from the root node to the final node is topologically deep and, vice versa, a path that has a low number of nodes is topologically shallow.
![]() Total depth (TD): This is defined by the number of spaces to pass through from a chosen or a given starting point in the system. The total depth of a system is the sum of all possible steps from a given starting point. The depth value, when combined with the actual shape of the system itself, provides important information for the interpretation and analysis of an urban space. The terms ‘shallow’ and ‘deep’ are most commonly used with regard to the depth of a system. A shallow system has a low total depth value, whereas a deep system has a high total depth value. The j-graph of a shallow system is bush-like and for a deep system it is tree-like (p. 94).
Total depth (TD): This is defined by the number of spaces to pass through from a chosen or a given starting point in the system. The total depth of a system is the sum of all possible steps from a given starting point. The depth value, when combined with the actual shape of the system itself, provides important information for the interpretation and analysis of an urban space. The terms ‘shallow’ and ‘deep’ are most commonly used with regard to the depth of a system. A shallow system has a low total depth value, whereas a deep system has a high total depth value. The j-graph of a shallow system is bush-like and for a deep system it is tree-like (p. 94).
Figure 4depicts how public spaces are abstracted as axial lines and make up an axial map 4 (b) of a settlement 4 (a). The spatial analysis 4 (c) presents the visualization of a global integration analysis of the axial map of the settlement. Below in Figure 4d, a j-graph (justified graph) is shown, using the main street as the root node A.

Figure 4. An axial map (b) and a global axial integration analysis (c) of a settlement (a) and the justified graph (d), with the root node A representing the main street.
![]() Connectivity: Connectivity is a static local measure and explains the number of connec- tions that each street has to its direct neighboring streets. In mathematics, connectivity is one of the basic concepts of graph theory. A street with many connections to its side
Connectivity: Connectivity is a static local measure and explains the number of connec- tions that each street has to its direct neighboring streets. In mathematics, connectivity is one of the basic concepts of graph theory. A street with many connections to its side
streets has a high connectivity value, whereas a street with few connections has a low connectivity value (p. 103), .
![]() Axial integration (Int): This measure considers to-movement and estimates the degree of accessibility that a street has to all other streets in the urban system, taking into consideration the total number of direction changes (syntactic steps) of an urban entity (p. 104). Axial integration is strongly related to connectivity. The fewer the direction changes of a certain street to all other streets in the system, the higher its integration, hence its inter-accessibility. In short, the longer the axial line in an urban area, the higher its connectivity to other lines and the higher its integration value and vice versa.
Axial integration (Int): This measure considers to-movement and estimates the degree of accessibility that a street has to all other streets in the urban system, taking into consideration the total number of direction changes (syntactic steps) of an urban entity (p. 104). Axial integration is strongly related to connectivity. The fewer the direction changes of a certain street to all other streets in the system, the higher its integration, hence its inter-accessibility. In short, the longer the axial line in an urban area, the higher its connectivity to other lines and the higher its integration value and vice versa.
![]() Global and local radii: Classic space syntax analyses generally use a topological radius, which refers to the number of direction changes. For the ‘global’ integration analysis (as coined in space syntax jargon), a radius of n is applied, whereas in the local integration analysis, radii of 3 or 5 are generally applied . Global axial integration analysis, also referred to as citywide integration analysis, calculates how every axial line is connected to all others in a built environment in terms of the total number of direction changes to all other axial lines (p. 135). In contrast, local axial integration analysis calculates how every axial line is connected to its neighboring streets in a built environment in terms of the given number of direction changes. It is important to note that the local radius was originally calculated by taking the root node into consideration. That means, for example, that a radius of 3 was calculated with two direction changes from the root node (=two syntactic steps + the root node). This changed after 2005, when the root node was no longer included. Consequently, a radius of 3 currently equals three direction changes (=three syntactic steps). Local integration analysis contributes to reducing the edge effect that appears in a global integration analysis.
Global and local radii: Classic space syntax analyses generally use a topological radius, which refers to the number of direction changes. For the ‘global’ integration analysis (as coined in space syntax jargon), a radius of n is applied, whereas in the local integration analysis, radii of 3 or 5 are generally applied . Global axial integration analysis, also referred to as citywide integration analysis, calculates how every axial line is connected to all others in a built environment in terms of the total number of direction changes to all other axial lines (p. 135). In contrast, local axial integration analysis calculates how every axial line is connected to its neighboring streets in a built environment in terms of the given number of direction changes. It is important to note that the local radius was originally calculated by taking the root node into consideration. That means, for example, that a radius of 3 was calculated with two direction changes from the root node (=two syntactic steps + the root node). This changed after 2005, when the root node was no longer included. Consequently, a radius of 3 currently equals three direction changes (=three syntactic steps). Local integration analysis contributes to reducing the edge effect that appears in a global integration analysis.
Figure 5explains how to calculate axial integration for topologically shallow and deep systems using the example of the settlement from Figure 4. We demonstrate how axial integration is computed. The bush-like j-graph with the main street as the root node is topologically shallower compared to the drawn-out j-graph with the back street as the root node. The main street can reach all streets with a low total number of direction changes, whereas the back street can reach all streets with a high number of direction changes.
To illustrate the application of basic space syntax concepts we used the case study of Rotterdam. Rotterdam is a major port city in the province of South Holland and the second largest city in the Netherlands. It has a population of approximately 650,000 and is known for its multi-ethnic mix. The near-complete destruction of the historic city center in WWII led to Rotterdam’s current urban landscape with modern architecture and skyscrapers.
Figure 6 shows three different types of axial analyses of Rotterdam. The global integration analysis (Figure 6c) shows where the most spatially integrated streets are located. For Rotterdam, the most integrated streets and roads are located on the ring road’s eastern sections. The red and orange axial lines show the 5% score of the most highly integrated streets. The local integration with a radius of 3 (Figure 6d) depicts the most integrated streets locally. In this analysis, the various local shopping streets are indicated by yellow and orange lines. The connectivity map (Figure 6b) shows how many direct connections each axis has to its direct neighboring axes. The dark blue lines have one to two connections, whereas the yellow and red lines have up to 32 connections.

Figure 5. (a) A topologically shallow j-graph of the main street and (b) a topologically deep j-graph of the back street; (c) explanation of how to compute ‘global’ axial integration for the shallow j-graph.
![]() A syntactic step: This refers to a single direction change in an urban system. For example, two syntactic steps mean two direction changes. Three syntactic steps mean three direction changes .
A syntactic step: This refers to a single direction change in an urban system. For example, two syntactic steps mean two direction changes. Three syntactic steps mean three direction changes .
![]() Two-step analysis: This type of analysis illustrates how many streets can be reached within two direction changes from a particular street or road or from a chosen set of streets and roads. This analysis method is mostly used to find out about a shopping street’s local catchment area .
Two-step analysis: This type of analysis illustrates how many streets can be reached within two direction changes from a particular street or road or from a chosen set of streets and roads. This analysis method is mostly used to find out about a shopping street’s local catchment area .
![]() N-step analysis or point depth analysis: This type of analysis shows how topologically deep all streets and roads are in relation to one particular street or several particular streets in terms of number of direction changes. The higher the number of direction changes from a chosen street or a set of chosen streets, the topologically deeper an area is .
N-step analysis or point depth analysis: This type of analysis shows how topologically deep all streets and roads are in relation to one particular street or several particular streets in terms of number of direction changes. The higher the number of direction changes from a chosen street or a set of chosen streets, the topologically deeper an area is .
Figure 7shows a two-step analysis of the Lijnbaan, one of the main shopping streets in the center of Rotterdam. The red axial line (Figure 7b) indicates the starting point for the analysis. The two-step analysis visualizes how many streets can be reached within two direction changes from the origin of the Lijnbaan and depicts the Lijnbaan’s local catchment area. Shopping streets often have high numbers of streets that are located within two direction changes . Even though the Lijnbaan’s location is spatially ‘hidden’ (Figure 7a), its connectivity within its local catchment area is high.


![]() Intelligibility: This is a measure of the correlation between citywide integration and connectivity values [48,49], or, more generally, the correlation between global and local integration values [14], that indicates how comprehensible an urban system is. The closer the correlation coefficient (R2) is to 1.0, the higher a system’s level of intelligibility. This means that, based on the street pattern logic of a local area, an entire city can be understood. The concept of intelligibility also refers to cognitive mapping, which is connected to Kevin Lynch’s concept of legibility [50].
Intelligibility: This is a measure of the correlation between citywide integration and connectivity values [48,49], or, more generally, the correlation between global and local integration values [14], that indicates how comprehensible an urban system is. The closer the correlation coefficient (R2) is to 1.0, the higher a system’s level of intelligibility. This means that, based on the street pattern logic of a local area, an entire city can be understood. The concept of intelligibility also refers to cognitive mapping, which is connected to Kevin Lynch’s concept of legibility [50].
Figure 8 shows the scatter plot of the local integration (Int r = 3) versus the global integration (Int r = n) of Rotterdam. The black pixels represent the streets (=axial lines) in the main center of Rotterdam. Even though Rotterdam’s center was heavily bombed in World War II, the original street pattern was kept during the rebuilding of the city center. The correlation coefficient (R2) for the whole city is 0.1359, which is low. The correlation coefficient (R2) for the city center is average with 0.4398.

Figure 8. A scatter plot of the intelligibility of Rotterdam, showing the correlation between local and global axial integration of Rotterdam.
![]() Radius-radius (RadR): The radius-radius measure was set up to minimize the edge effect for a whole spatial system. Radius-radius calculations, which were popular in the past, work with mean depth in the sense that this represents the real-life character of a utilization pattern. Radius-radius analysis is an axial integration analysis that uses the mean of the mean depth values of the most globally integrated axial lines in the system, using this as the maximum radius. This is done to reduce the edge effect (p. 120).
Radius-radius (RadR): The radius-radius measure was set up to minimize the edge effect for a whole spatial system. Radius-radius calculations, which were popular in the past, work with mean depth in the sense that this represents the real-life character of a utilization pattern. Radius-radius analysis is an axial integration analysis that uses the mean of the mean depth values of the most globally integrated axial lines in the system, using this as the maximum radius. This is done to reduce the edge effect (p. 120).
![]() Integration gradient: This was a first attempt at drawing up an equation for the iden- tification of main routes in a city. It takes the local integration into account in the calculation. An integration gradient of r = 3 with real relative asymmetry (RRA) is calculated as follows: (RRA3)/average{average{RRA3}} . Angular choice analysis (see Section 2.2) replaced the integration gradient calculations.
Integration gradient: This was a first attempt at drawing up an equation for the iden- tification of main routes in a city. It takes the local integration into account in the calculation. An integration gradient of r = 3 with real relative asymmetry (RRA) is calculated as follows: (RRA3)/average{average{RRA3}} . Angular choice analysis (see Section 2.2) replaced the integration gradient calculations.
![]() Constituted and unconstituted street and urban spaces: When a street or urban space has entrances that are directly connected to it from adjacent buildings, the street or urban space is constituted. An unconstituted street or urban space has no entrances connected to it (p. 105).
Constituted and unconstituted street and urban spaces: When a street or urban space has entrances that are directly connected to it from adjacent buildings, the street or urban space is constituted. An unconstituted street or urban space has no entrances connected to it (p. 105).
![]() Edge effect: An edge effect exists for global axial integration. Local measures, such as a radius of 3, minimize the edge effect but do not eliminate it. It is, therefore, important to have an adequate spatial buffer around the nodes (or area) to produce correct and ‘clean’ results. Axial maps that do not take a spatial buffer into consideration with axial integration produce artificially low results in those areas that do not have an accurate buffer zone around them [3] (p. 120). A spatial buffer handles the size of the contextual area. Different research approaches lead to different answers to this issue. As a rule of thumb that is used in practice, a 30-min test is most commonly applied. This test equals a 30-min walk (approximately 2000 m), if pedestrian movement is examined. Similarly, the Agora Technology Platform report mentions that a vehicular axial map would select an area encompassing a 30-min drive from the area of interest. Consequently, vehicular maps are quite large and often depict the whole city under investigation.
Edge effect: An edge effect exists for global axial integration. Local measures, such as a radius of 3, minimize the edge effect but do not eliminate it. It is, therefore, important to have an adequate spatial buffer around the nodes (or area) to produce correct and ‘clean’ results. Axial maps that do not take a spatial buffer into consideration with axial integration produce artificially low results in those areas that do not have an accurate buffer zone around them [3] (p. 120). A spatial buffer handles the size of the contextual area. Different research approaches lead to different answers to this issue. As a rule of thumb that is used in practice, a 30-min test is most commonly applied. This test equals a 30-min walk (approximately 2000 m), if pedestrian movement is examined. Similarly, the Agora Technology Platform report mentions that a vehicular axial map would select an area encompassing a 30-min drive from the area of interest. Consequently, vehicular maps are quite large and often depict the whole city under investigation.


 发表于 2021-12-25 15:54
 收藏
收藏  支持
支持  反对
反对  回复
回复 呼我
呼我

 支持
支持 反对
反对